Intuitive Physics — Real vs. Reversed
Can predicted brain responses distinguish real physical events from time-reversed versions? Using videos from the Physics-IQ benchmark (Google DeepMind), this experiment tests whether TRIBE v2's V-JEPA2 encoder captures the brain's intuitive physics engine.
Summary
TRIBE v2 predicted brain responses distinguish real physics videos from time-reversed versions with 95% accuracy on completely unseen scenes (0.985 AUC) — a gold-standard holdout test with zero data leakage. The classifier was trained on 50 scenes (100 videos) using GroupKFold cross-validation with a Pipeline (86% CV accuracy, 0.946 AUC), then evaluated on 20 entirely new scenes (40 videos) it had never encountered. Only 2 out of 40 holdout videos were misclassified — both reversed clips mistaken as real. Since real and reversed videos contain identical visual content (same objects, colors, scenes), the signal must arise from temporal motion dynamics. This strongly suggests TRIBE v2's V-JEPA2 video encoder has learned representations that align with the brain's intuitive physics network, and that this alignment generalizes to novel physical scenarios.
Key metrics
Holdout Acc
95.0%
Accuracy on 40 completely unseen videos (20 scenes)
Holdout AUC
0.985
ROC AUC on holdout set
CV Accuracy
86.0%
GroupKFold CV on training set (no leakage)
CV AUC
0.946
ROC AUC on GroupKFold CV
Train Scenes
50.0
50 scenes (100 videos) for training
Holdout Scenes
20.0
20 unseen scenes (40 videos) for testing
Features
20,484
Cortical vertices per sample
Regularization
L1 (C=1.0)
SAGA solver, lasso penalty
Confusion matrix
Actual
Predicted
Classification report
| Class | Precision | Recall | F1 | Support |
|---|---|---|---|---|
| Real | 0.91 | 1.00 | 0.95 | 20 |
| Reversed | 1.00 | 0.90 | 0.95 | 20 |
| Macro avg | 0.96 | 0.95 | 0.95 | 40 |
PCA projection
PC1 (63.1% var)
PC2 (17.6% var)
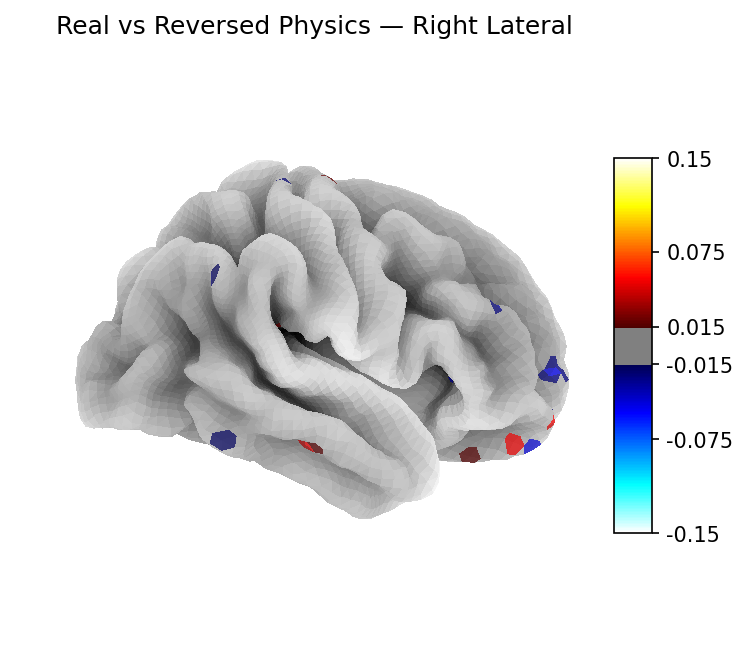
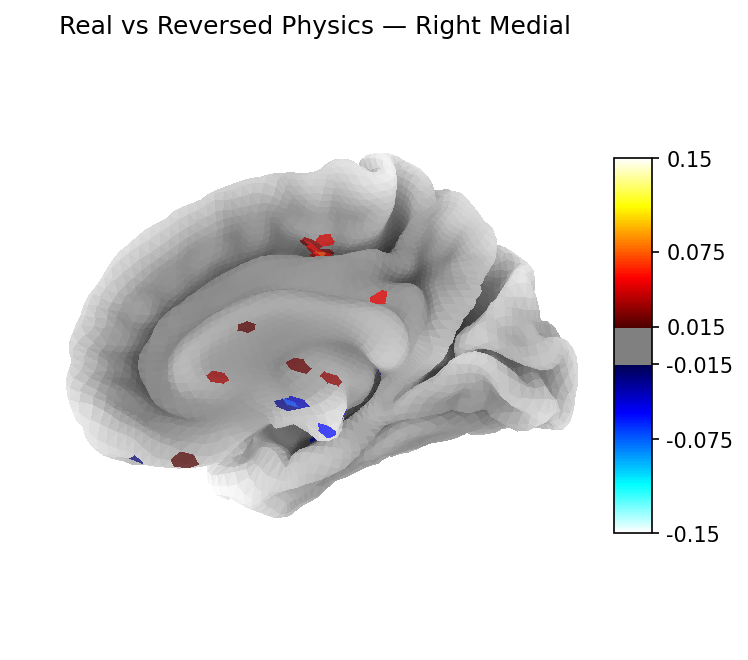
Discriminative brain regions
99%
202 / 20,484
Reversed-predictive (physics violation)
Real-predictive (normal physics)
Regions identified via L1-regularized logistic regression weights mapped onto the Destrieux cortical atlas (fsaverage5). Percentages reflect each region's share of total cortical weight for its category (excluding medial wall vertices).
Interested in what these regions mean? Read the full discussion — a region-by-region analysis comparing these findings to published neuroscience literature.
Figures
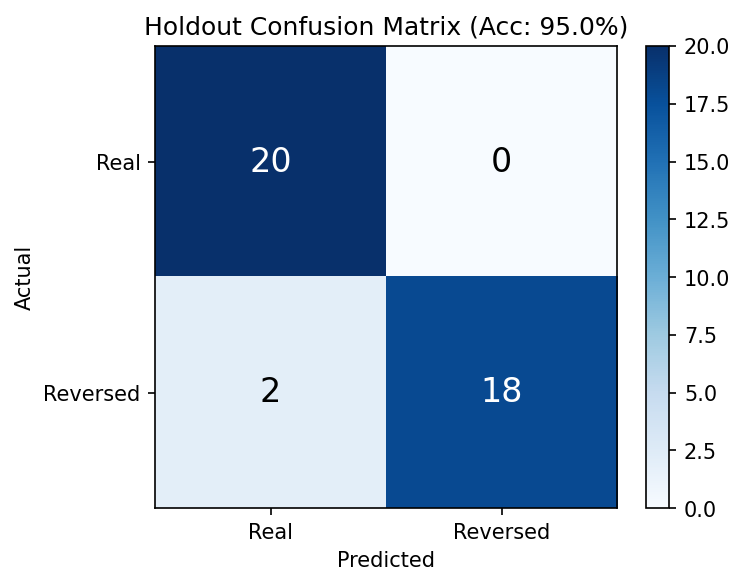
Holdout confusion matrix — Unseen scenes
Gold-standard test on 20 completely unseen scenes (40 videos). 20/20 real videos correct, 18/20 reversed correct. Only 2 reversed clips were mistaken as real — the model never saw these scenes during training.
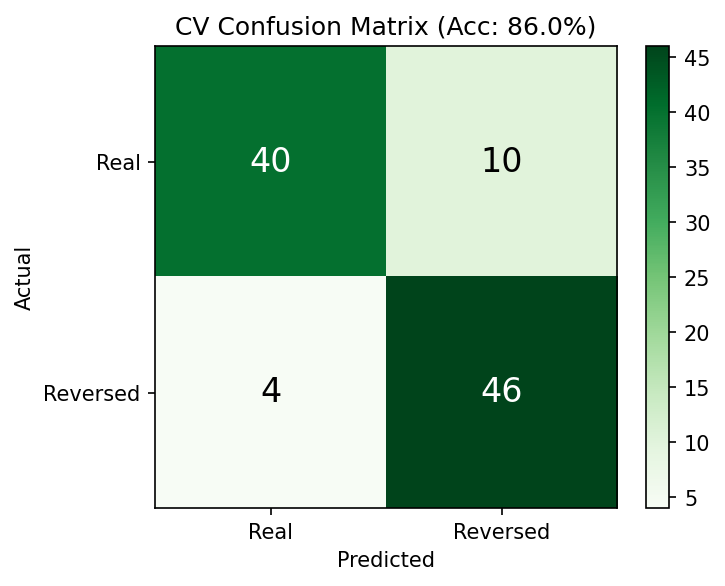
CV confusion matrix — Training scenes (GroupKFold)
5-fold GroupKFold cross-validation on the 50 training scenes (100 videos). Paired real/reversed videos always in the same fold — no leakage. 86% accuracy.
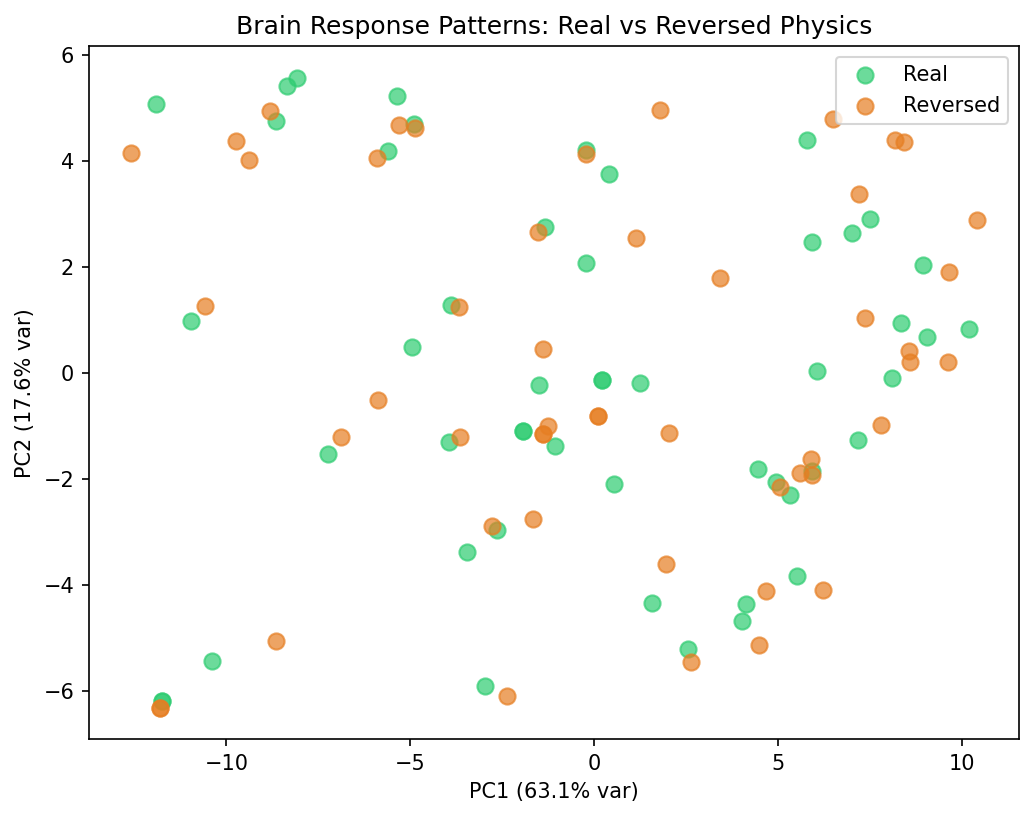
PCA scatter — Brain response patterns
First two principal components of brain activation vectors (PC1: 63.1% var, PC2: 17.6% var). Real and reversed clusters show partial separation in low-dimensional space.
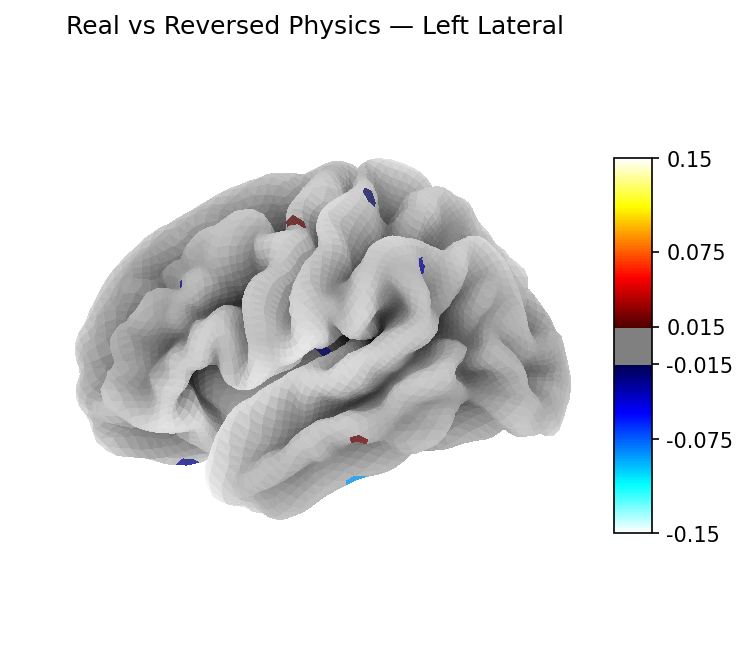
Classifier weights — Left lateral
Logistic regression weights projected onto the left lateral brain surface. Sparse activation reflects the L1 penalty selecting only the most discriminative vertices.
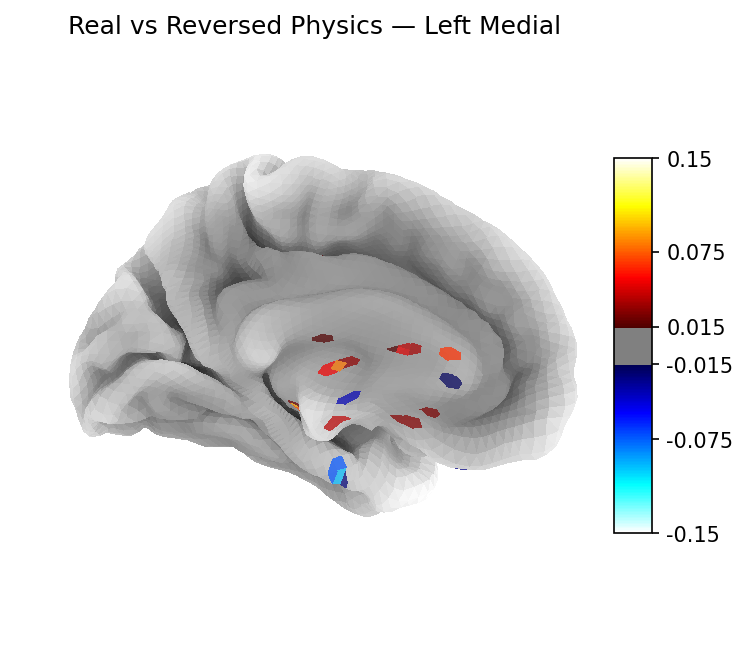
Classifier weights — Left medial
Logistic regression weights on the left medial surface.
Classifier weights — Right lateral
Logistic regression weights on the right lateral surface.
Classifier weights — Right medial
Logistic regression weights on the right medial surface.
Experiment data excludes raw stimuli and large prediction arrays.
Back to experiments